GraphJSON vs Mixpanel

When it comes to choosing the right analytics tool for your application or website, it's important to compare your options to find the best fit for your needs. In this blog post, we will compare GraphJSON and Mixpanel, two popular analytics tools. While both platforms offer a wide range of features, we will highlight the reasons why GraphJSON stands out as the superior choice.
Introduction to GraphJSON
GraphJSON is a flexible and powerful analytics tool that enables you to visualize and analyze your application data with ease. Built on top of Clickhouse, a fast and scalable columnar database, GraphJSON provides a variety of visualization options, custom SQL query support, and a user-friendly interface.
Introduction to Mixpanel
Mixpanel is a well-known analytics platform that focuses on tracking user interactions and providing insights into user behavior. It offers a wide range of features, including funnel analysis, retention cohorts, and A/B testing, making it a popular choice for many businesses.
Why GraphJSON is the Better Choice
-
Data Storage and Flexibility GraphJSON stores your data as JSON in a Clickhouse table, providing unparalleled flexibility when it comes to data structure. With no need to define schemas ahead of time and support for almost every language's JSON library, GraphJSON makes it easy to adapt to your specific data needs.
Mixpanel, while offering a rich set of features, relies on a predefined data model, which may limit your ability to work with custom data structures or non-web-based applications.
-
Custom Querying and Data Analysis GraphJSON allows you to write custom Clickhouse SQL queries, giving you the power to perform complex data analysis and create advanced visualizations. This level of flexibility and expressiveness is not available in Mixpanel.
Mixpanel provides built-in reports and data analysis tools, but it does not offer the same level of customization and expressiveness as GraphJSON when it comes to querying and visualizing data.
-
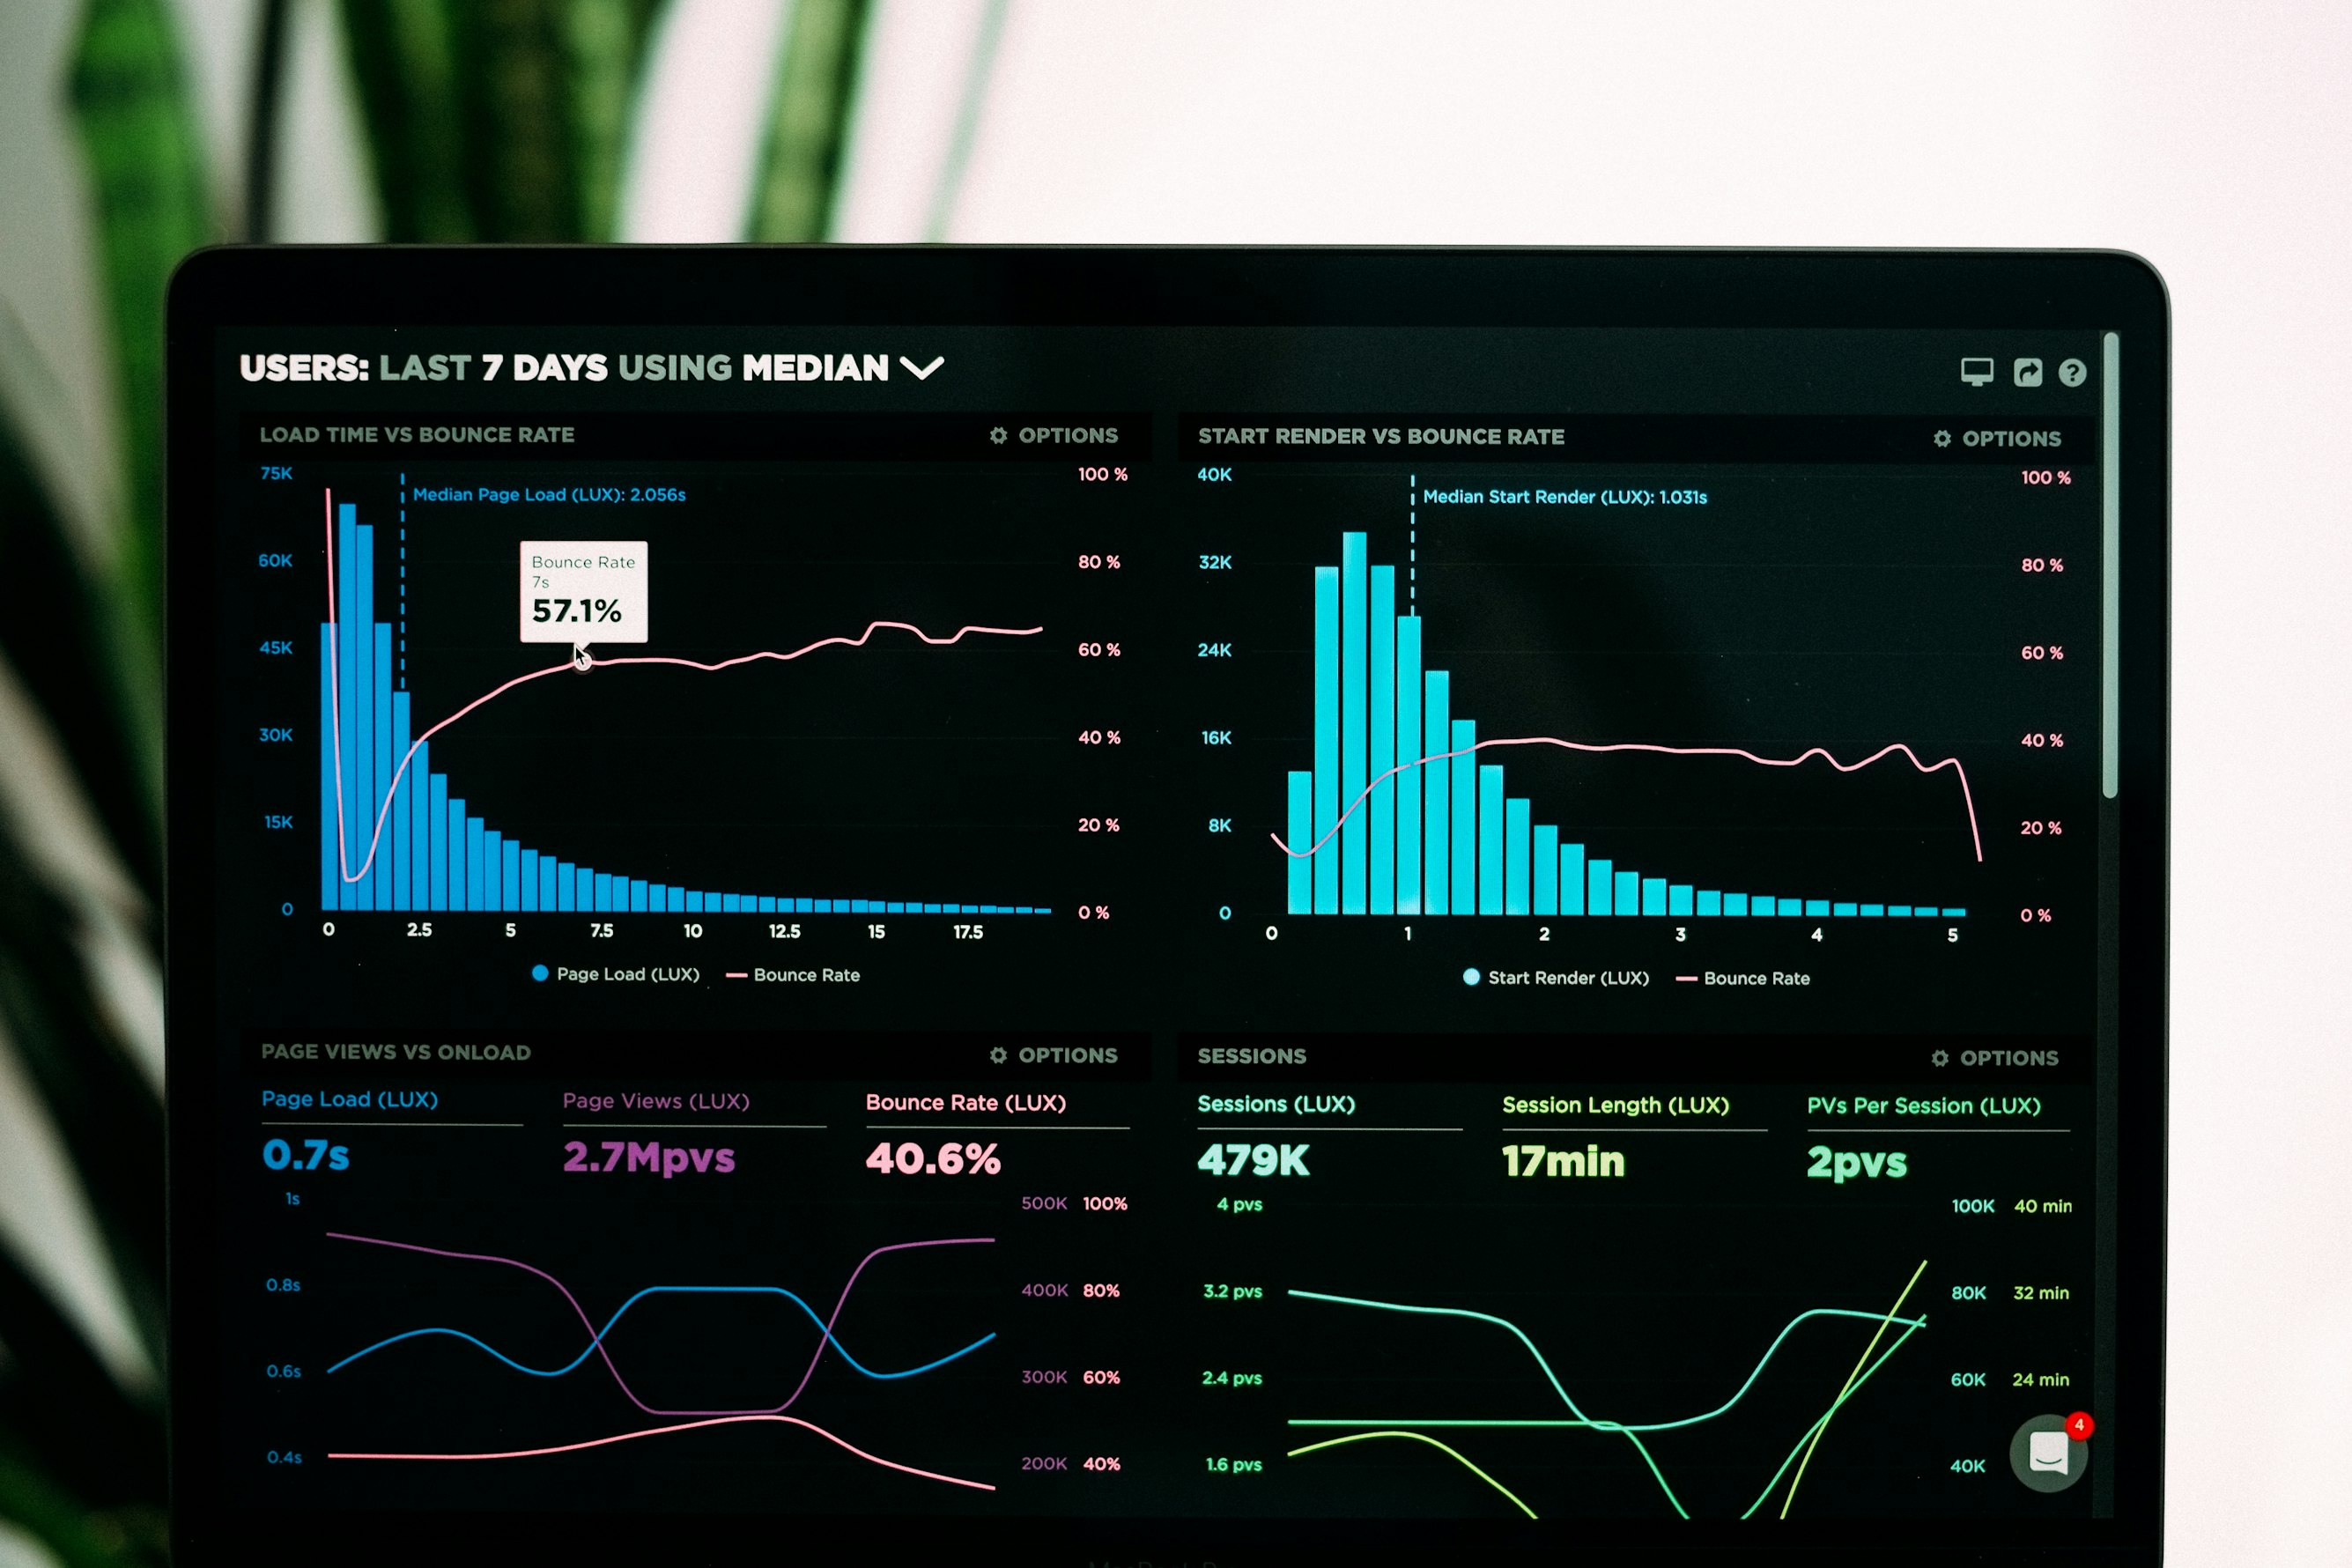
Visualization Options GraphJSON supports a wide range of visualization options, allowing you to create custom graphs and charts with just a few clicks. It also offers a visualization tab for SQL queries, enabling you to easily visualize your custom data analysis.
Mixpanel provides a variety of visualization options within its built-in reports, but it does not offer the same level of customization as GraphJSON when it comes to visualizing custom data queries.
-
Integration and Compatibility GraphJSON can be integrated with various applications and services, as demonstrated by its use in projects such as Flurly, Cronitor, Meeting Room 365, and more. Its flexibility in handling custom data structures makes it suitable for a wide range of use cases.
Mixpanel is primarily focused on tracking user interactions, making it best suited for websites and web applications. While Mixpanel offers integration with other platforms, it does not provide the same level of flexibility as GraphJSON when it comes to handling custom data structures.
-
Pricing and Personalized Support GraphJSON pricing details can be found on their website. The indie nature of the project often results in a more personalized support experience, with the option to directly contact the creator via Twitter for assistance.
Mixpanel offers a free tier with basic features and additional pricing tiers based on data volume and features. While Mixpanel has a dedicated support team, it may not provide the same level of personalized support that GraphJSON offers.
Conclusion
We think the choice is clear. If you want a dead simple way to start logging and analyzing JSON events, sign up here.
If you have any questions, feel free to DM me directly on twitter @TheBuilderJR
We think the choice is clear. If you want a dead simple way to start logging and analyzing JSON events, sign up here.
If you have any questions, feel free to DM me directly on twitter @TheBuilderJR